This page explains each part of this solution, in the order the parts run. It follows the code and explains what that code does.
Contents#
- What the geometry proposes
- What the filter removes before the model is asked
- The model: boosted trees that score one candidate at a time
- The inputs are lengths, counts and ratios
- How it is trained
- Where the learned part sits is what makes it safe
- It is the teacher
1. What the geometry proposes#
The geometry comes first, because it decides which pushes the model will see. The part of the code that lists the pushes is called the enumerator.
For one crowded glass, the enumerator tries 72 headings, one every 5°, all the way round. A heading is a direction of push. Along each heading it tries longer and longer pushes, in 2 mm steps up to 150 mm. At each step it asks four questions.
- Does the path of the moving glass miss every other glass?
- Does the path of the fingers miss them?
- Does the path of the wrist and the gripper body miss them?
- Is the end point inside the glass zone and easy for the arm to reach?
If any answer is no, the heading stops there. A clash at one length is still there at every longer length on the same line.
Two facts about this loop decide everything after it.
Each heading stops at the first push that gives the glass room. So each heading gives at most one push that finishes the job. One glass can have at most 72 of these. Each one is the shortest push that works along its line.
Pushes that do not finish the job are kept too. A push that leaves the
glass still crowded is kept if it cuts the table's total lack of room by at
least 10 mm. The printed rule uses these pushes only when no push on the table
finishes the job. This set is large, because it holds every 2 mm step up to the
first clash. spread.json gives the counts. Over 269 crowded glasses on the
training tables, the middle glass gets 84 candidates. Over 101 whole-table
decisions, the middle decision gets 261.
The first fact is the most important point on this page. Each heading stops as soon as the push works. So every push that finishes the job ends on the same line: just past the point where the glass has enough room, plus a 10 mm margin for aiming error. They reach the same result from different directions. The run is scored on how many glasses have room. On that score, these pushes are a tie. They differ only in how far the glass travels, and the geometry already knows that distance.
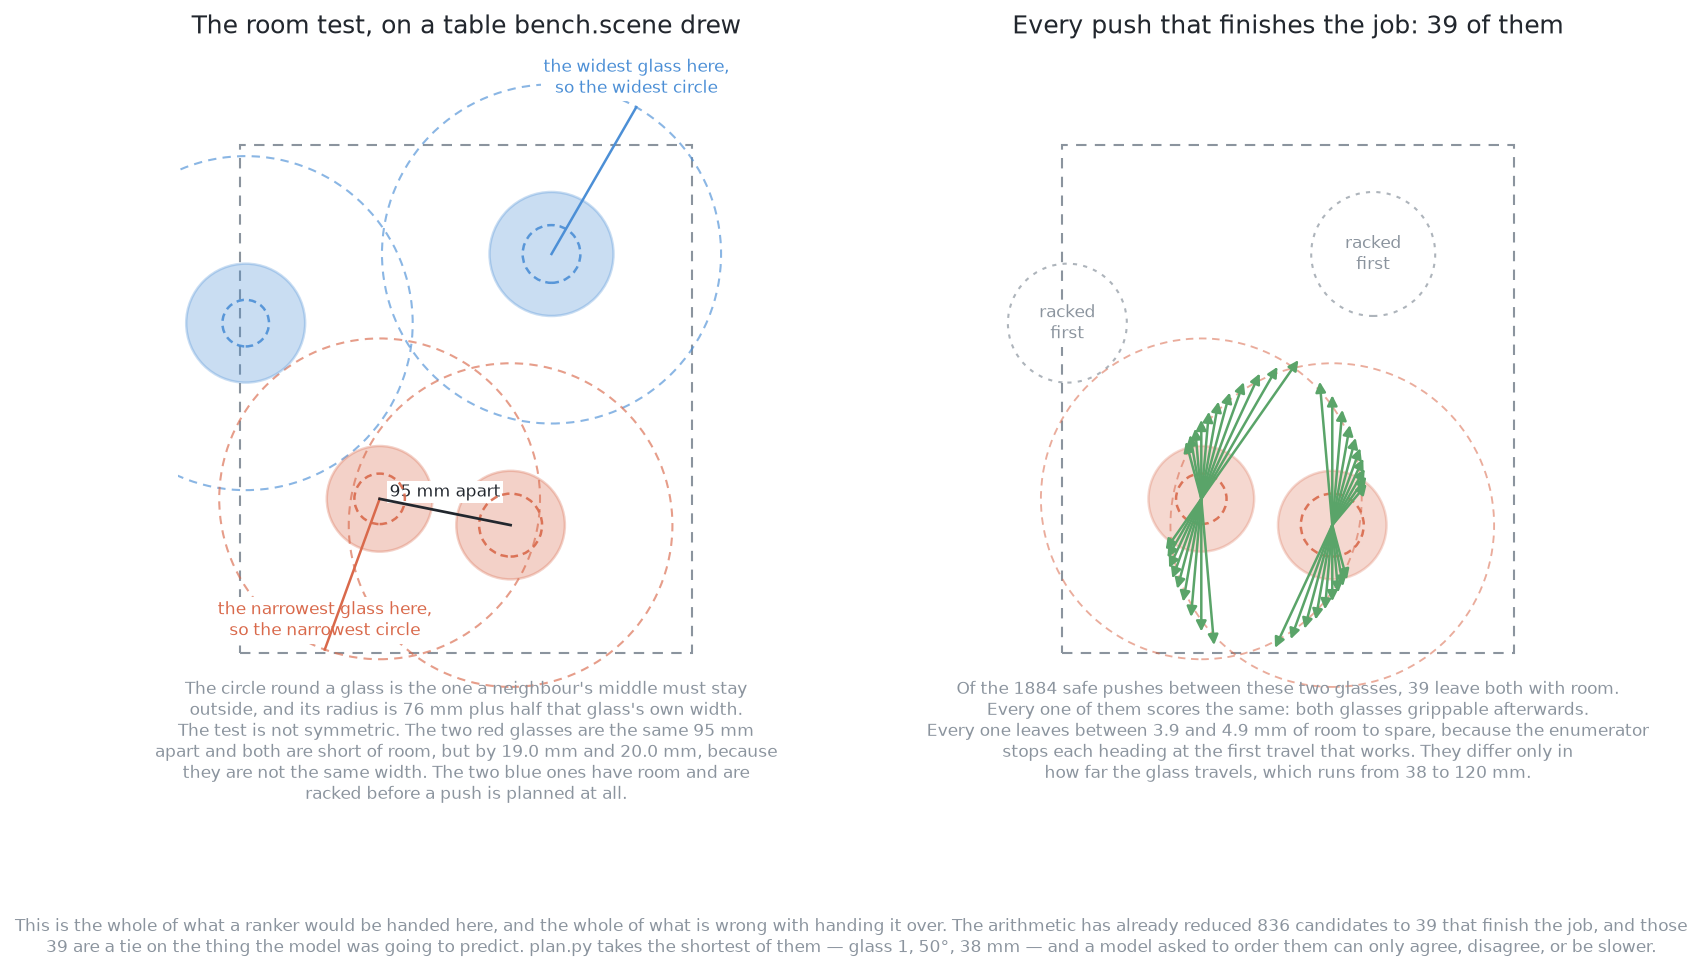
When every choice in a group is tied, ranking the group tells you nothing. A model would give each push the same value. That answer is correct, but it is no help. So a ranker can only learn something from the pushes that ease the crowding without finishing the job. Those pushes really do differ from each other.
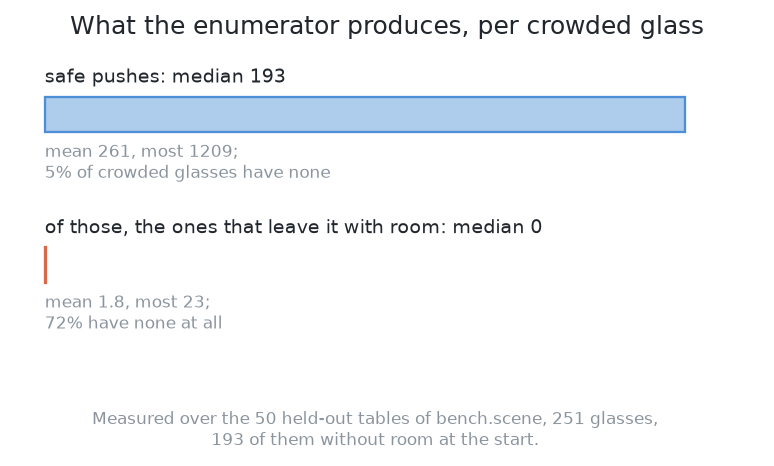
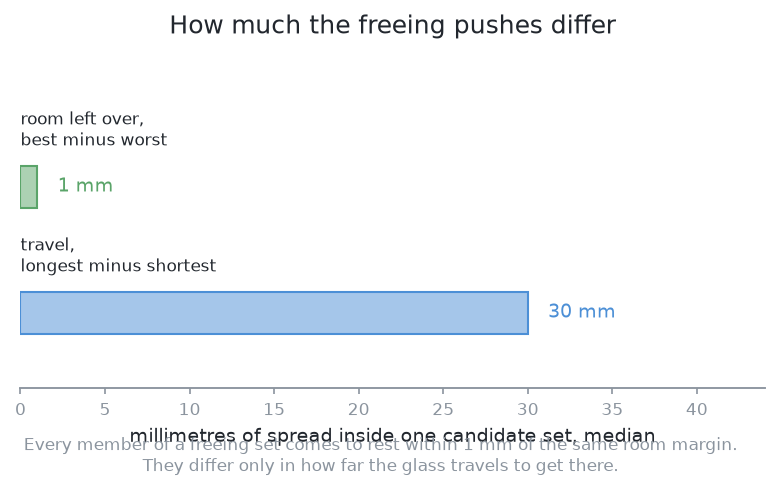
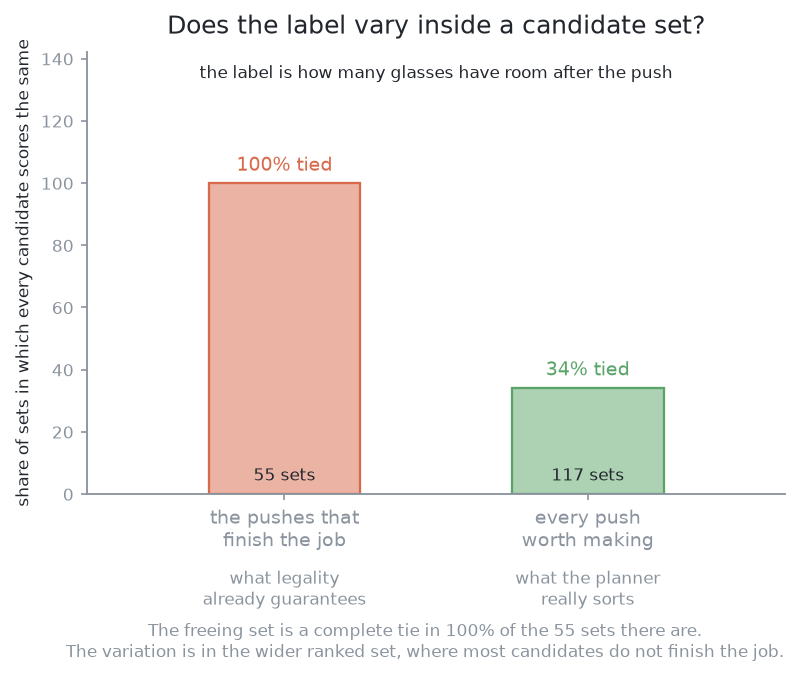
Three measurements over fifty held-out tables show how far this goes. The three pictures below show them one at a time.
The first picture counts the pushes the enumerator finds for each crowded glass. The geometry can almost always find a safe push. It can rarely find one that finishes the job. So 72 per cent of the time, the planner uses a push that only helps a little.
The second picture asks how much the pushes that finish the job differ. They all leave the glass within one millimetre of the same room. They differ only in how far the glass travels.
The third picture asks whether the label changes inside a group at all. In the groups that finish the job, it never does. In the wider groups, it sometimes does. That is the only place a ranker could learn anything.
So, before the model is even described, the arithmetic has already answered most of its question. The next section looks at the one test that removes pushes for safety.
2. What the filter removes before the model is asked#
The previous section listed the pushes. One test on that list needs its own section, because it guards against the one failure that cannot be repaired: a toppled glass.
A glass slides if the jaw touches it low enough, and tips if the jaw touches it too high. Pushing without toppling explains the rule in full, with the heights of the jaw and the unknown friction.
What belongs to this solution is where the test runs. It runs inside the filter, before the model. So a glass that would tip never reaches the model, and no score can bring it back.
The next section turns from the filter to the model itself.
3. The model: boosted trees that score one candidate at a time#
The filter leaves a list of safe pushes. The model must turn each push into one number, and this section explains how.
A decision tree is a chain of yes-or-no questions. Each question looks at one input, for example "is the push longer than 50 mm?". The answer sends the push left or right. At the end, the push reaches a leaf, and the leaf holds a number. That number is the tree's answer. One tree is a rough predictor, because it can give only a few different answers.
Boosting turns many rough trees into one good model. It works like this.
- Fit one small tree to the data.
- Find what that tree got wrong for each push.
- Fit the next tree to those errors, so it corrects the first tree.
- Add the trees together, find what the sum still gets wrong, and fit another tree to that.
- Repeat.
The sum of all the trees is the model. This solution uses two hundred trees, each three questions deep. That is a normal size for its 4,844 rows of data.
This solution uses the regression form, which predicts a number. It also scores pointwise. This means the model sees one push at a time and scores it alone, without seeing the other pushes. The pushes are then sorted by score. This is the simplest way to fit a ranking. Learning to rank describes the other two ways.
Why trees rather than a network#
The input is a short list of mixed quantities: an angle, some lengths, a count and a ratio. Boosted trees were made for this kind of input. There are three reasons.
First, a tree does not care about the scale of its inputs. An angle, a length in millimetres and a count have very different ranges. A neural network adds its inputs together with weights. So a network needs its inputs rescaled first, or the large ones would swamp the small ones. A tree never adds its inputs. It compares one input with one threshold, so rescaling changes nothing.
Second, a threshold fits this problem. Many questions about a good push are comparisons with a limit. Is the end point clear enough for the gripper? Is the push height below the tipping limit? Is the end point far enough from the edge of the zone? A tree asks each of these as one question. A network needs more data to learn a sharp limit.
Third, boosted trees report how much each input mattered. So a person can read the list and find out why the model chose wrong.
A network would also work. On this input, a small network would need more data and would explain less. But the input could be different. The model could be given an occupancy grid instead, which is a picture of the zone with the glasses marked on it. Then a network would be the right choice, because a network reads a picture well and a tree does not. So the real choice is the input: a short list of numbers, or a picture of the table. The model follows from that choice. This solution uses the short list, for the reason the next section gives.
4. The inputs are lengths, counts and ratios#
The previous section chose a short list of numbers as the input. This section says which numbers, and why none of them is a position on the table.
For each push, features.py gives the model these eight numbers, in this order.
- The contact angle. It is measured from the line between the glass and the nearest neighbour's edge. So "push straight away from the crowd" is always the same value, wherever the glass stands.
- The push distance. This is how far the glass travels after the jaw touches it.
- The clear room at the end point. This is the room the glass would have after the push.
- The distance from the end point to the edge of the glass zone.
- The distance from the end point to the rack.
- How many neighbours stand within a set radius of the glass. This is the one input that describes the crowd and not the push.
- The foot width of the glass. The tipping limit depends on it.
- The push height divided by the tipping limit. The limit here is for this glass's foot at the worst friction in the believed range. The jaw height is fixed, so this ratio changes only with the glass. It says how close the push is to tipping the glass.
Each input is a relation between two things, or a property of the glass, or a comparison with a limit. None of them is "this push happens at x = 430, y = −290".
Leaving out the position is deliberate. The examiner places crowded glasses by a fixed rule, as the examiner describes. Over many tables, crowds appear more often in some parts of the zone than others. Give the model the position, and it will learn that pattern, because the pattern is real in the training data. The model would then score a push by where it is on this table. That is a fact about this examiner's rule, not about pushing. If you move the rack or the zone, or place the tables by another rule, the model describes a cell that no longer exists. Nothing would show an error.
With relational inputs, this problem mostly goes away. Slide a whole group of glasses across the zone, and six of the eight inputs stay the same. These six are the contact angle, the push distance, the room at the end point, the neighbour count, the foot width and the tipping ratio. A model given positions would have to learn this from data, and it would learn it badly.
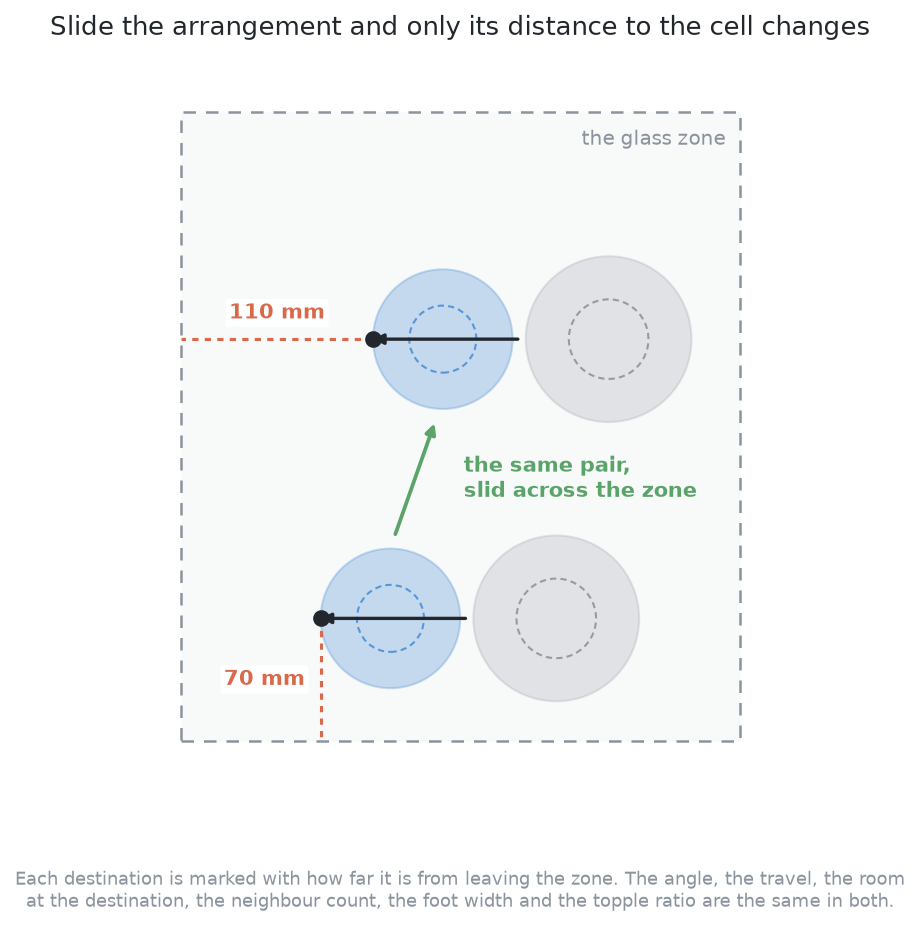
The other two inputs do change when the glasses slide, and they should. They measure the distance to the edge of the zone and to the rack, and those did not move. But they are still relations, not positions. An end point 15 mm from an edge has 15 mm of margin wherever the edge is. A push with little margin really is a worse push. The rule to remember is this: show the model the quantities the physics depends on. The physics of a push depends on distances, angles and widths, not on where the table's origin is.
The inputs are now fixed. The next section says how the labels for them are collected.
5. How it is trained#
The inputs come from the geometry. This section explains where the labels come from, and why they cost nothing.
The training has four steps.
- List the candidate pushes on the training tables. The examiner numbers its tables and keeps the ones above a dividing line for testing. So training uses only tables below that line. No solution is ever scored on a table it was trained on.
- Make every candidate push in the simulator. Reset the table, make the push, and measure the result. On a real arm this would take far too long. Here it is cheap, because a push in MuJoCo is fast. The 4,844 pushes in the training set came from 190 training tables in minutes. This is why the data costs almost nothing.
- Label each push with what happened. The label has two parts. The first is how much clear room the whole table gained. It is measured over the whole table, so a push that frees one glass by crowding another does not get full credit. The second is whether a glass toppled. A topple makes a push the worst possible candidate.
- Fit the model to those labels. Only the order of the model's answers is used later.
Two points about the labels need more explanation.
Some pushes in the training set toppled a glass, even though the filter removes unsafe pushes. This is not a contradiction. The filter uses a guessed friction. When the guess is too high, the filter lets through a push it should have refused, and the glass falls. 57 of the 4,844 rows are like this. These rows are useful. They teach the model to prefer pushes that stay further from the tipping limit. This is why the input "push height divided by the tipping limit" is in the list. It lets the model be careful about a number nobody measured.
The labels are only as true as the examiner's friction. The examiner uses three fixed friction values, not measurements of real glass. So the model has learned what topples in this simulator. Using it on a real table would rely on a friction value that was never checked.
One more warning applies to retraining. During a run, only the chosen push is ever made. So a log from a run has results only for pushes the model already likes. Retraining on that log fixes whatever the model believed first. The usual fix is to sometimes make the second-best push instead. Retraining should also happen between runs, never during one. A model that changes during a run makes the run impossible to repeat, and a run you cannot repeat is hard to debug.
The model is now trained. The next section asks what happens when it is wrong.
6. Where the learned part sits is what makes it safe#
The previous sections put a fitted model inside a machine that handles glass. So the next question is what happens when the model is wrong. The answer is that it can only waste a push, because the geometry settles every unsafe push first. What it is explains this in full.
The same design is used for choosing camera positions in the camera book. But there is one difference, and it raises the bar here. A wasted look only costs a few seconds. A wasted push costs a few seconds and a touch on a glass, and a touch is when things break. So a push ranker must be better than a camera ranker to be worth as much.
Safety is the first reason this solution matters. The next section gives the second reason.
7. It is the teacher#
The previous section showed that this solution is safe. This section shows that three other solutions cannot start without it. This is the biggest thing it gives.
Solution 3 and solution 6 both learn from demonstrations. A demonstration is a recorded example of the task being done. Here, one demonstration is one crowded table, from the first look to a table where every glass has room, with each push recorded. Usually, demonstrations are expensive, because a person must drive the arm by hand. That is why imitation learning is often judged by how few demonstrations it needs.
Here, demonstrations cost nothing. This solution can run on as many training tables as the examiner can make. Each run records a full demonstration with no person present. The pushes in it are safe, because the same filter protects them. Two hundred training tables gave 896 pushes in 52 seconds. So the only cost is simulator time.
Solution 7 learns
from the same pushes too. It reads solution 6's demonstrations as they stand.
The teacher's pushes are also used to test ideas about pushing itself. The
project's
measure_push_speed.py
replays the push it chose at five speeds. A slower push did not topple fewer
glasses. Pushing without toppling
gives that result.
This is a real gift, but it has two costs. Both reach the solutions that learn from it.
The students inherit this solution's ceiling. A policy trained on demonstrations learns to copy them. Every demonstration here comes from the enumerator. So the demonstrations hold only pushes that the enumerator can list. Suppose the headings are too far apart to include the best push. Or suppose a test wrongly rejects a good push. Then that push is in no demonstration, and the student can never find it. So a student trained only on this teacher cannot do better than this teacher. The usual fix is to let the student act, score what happens, and learn from that too. But that is no longer imitation learning, and it costs much more.
Keeping only the successful demonstrations gives a biased sample. It is
natural to keep the runs that finished the table and throw away the rest. But
the finished runs are not a fair sample of the tables. They are the tables this
solution is good at. The hard tables are the ones where the geometry runs out
of useful pushes. In this solution's own results.json, 43 of its 143 refused
glasses were still without room after pushing. Those hard tables are the ones
most likely to be thrown away. So a student trained only on successes learns
from easier tables than the ones it is tested on. It looks better in training
than in the test. There are two fixes. You can keep the failures with their
results. Or you can weight the kept runs so that hard tables count more. Doing
neither is the common mistake.
This page has explained each part. The next page, a worked example, follows one table through all of them.
← The code · A worked example →