The page before this one, vision backbones, explained the large shared part of a vision model. That part reads a picture and turns it into numbers. It ended with the point that one backbone can serve several different jobs, because each job only needs its own small head. This page is about those jobs. It explains what each job gives back, how a guess is scored against the truth, and why the job that a robot arm needs is often not the job a beginner asks for first.
The page answers six questions. What are the four different jobs that people run together under the word recognition, and which one does an arm actually need? What is a box, written as a set of numbers, and how do you measure whether a guessed box is right? Why does a detector produce many overlapping guesses, and what removes the extra ones? How do you measure a detector honestly? How do modern detectors avoid producing overlapping guesses at all? And what is a mask, written as numbers, including the kind of model that gives you one without being told what the thing is?
It is written for a reader who has read vision backbones, because the words backbone, head, feature grid and stride are used here without being explained again. It also assumes that you know what a score between 0 and 1 means, from the score of being wrong, and that you know the idea of training on labelled examples from what a model is.
Everything in the pictures is worked out by the script that draws them. The camera scene is simulated, which means that it is drawn out of rectangles and ellipses rather than photographed. The detector's guesses are simulated as well. Each true box is moved by a small random amount, and each guess is given a score that is higher when the guess covers the object better, which is how a trained detector behaves. Every method that is then run on those guesses is the real method. The models you can download are catalogued in object detection and segmentation.
Contents#
- Four jobs that are easy to confuse
- What a box is, and how a guess is scored
- Why a detector guesses many times
- Measuring a detector honestly
- Set prediction: slots matched one to one
- Masks, and models that take a prompt
- Where to read next
- Using it in Python
1. Four jobs that are easy to confuse#
The backbone from the last page gives back numbers that describe a picture. The first thing to settle is what you want those numbers turned into, because there are four different jobs here, and people often use the single word recognition for all four of them. The simulated scene used throughout this page holds six objects of four kinds: three drinking glasses standing close together, a mug, a box, and a small bolt a long way back on the table.
The picture below shows that one scene answered in all four ways, so that the four answers can be compared side by side.
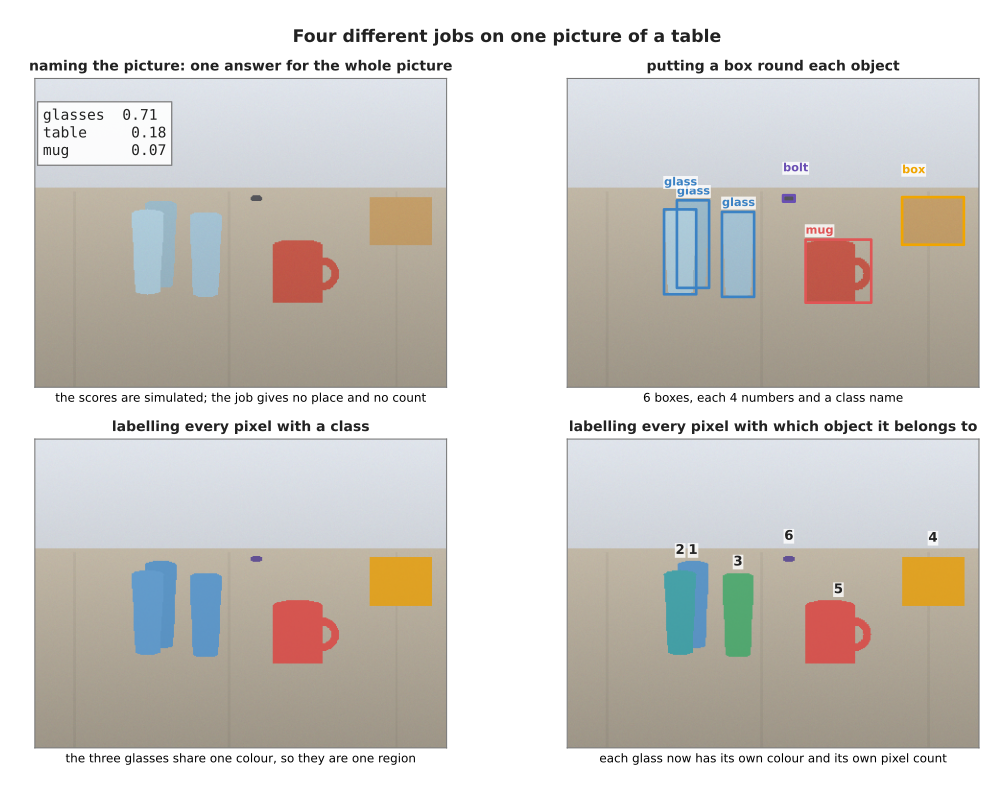
The first job gives one name for the whole picture. The second gives six boxes. The third gives four coloured regions, one for each class, in which the three glasses share a single colour. The fourth gives six coloured regions, one for each object.
The first job names the picture, with no place and no count, so it cannot tell you that there are three glasses. The second job puts a bounding box round each object. A bounding box is a rectangle whose sides are lined up with the sides of the picture, and it comes with a class name and a score. The third job labels every pixel with a class, so it marks the glass pixels as glass and the table pixels as table. The fourth job labels every pixel with which individual object it belongs to, and that job is called instance segmentation.
The difference between the third job and the fourth is the one that matters on a robot arm. The three glasses show why, so the next picture draws them under both jobs, with the middle of each region marked by a cross.
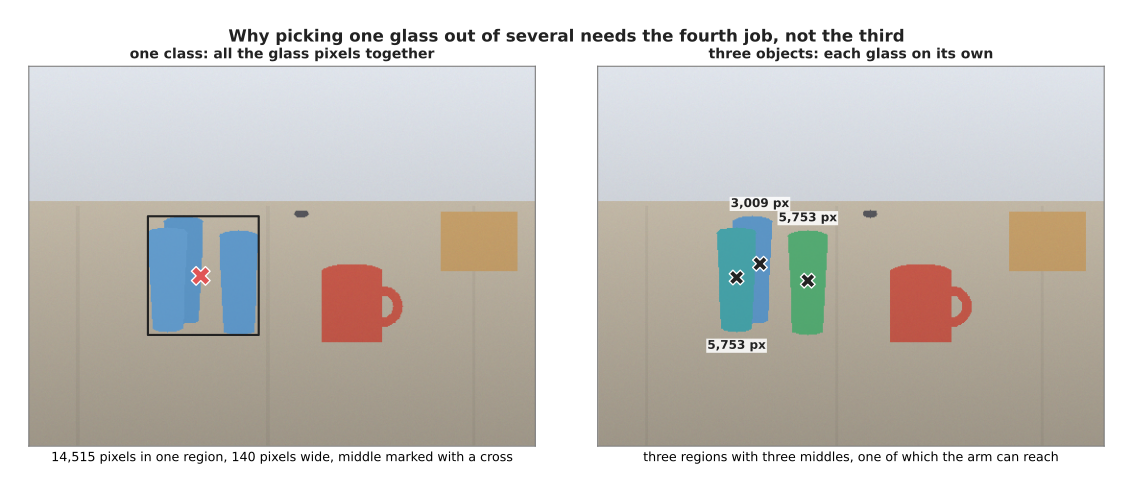
Labelling by class puts all 14,515 glass pixels into one region that is 140 pixels wide, and the middle of that region, at (217, 264), lands on no glass at all. Labelling by object gives three regions of 3,009, 5,753 and 5,753 pixels, with three middles that each land on a glass.
The class region is 2.8 times as wide as one glass, so its middle falls in the gap between two of them. An arm sent to that point would close its fingers on nothing. Labelling by object instead gives three regions with three middles, and each of those is a point the arm can really go to.
The four jobs also differ in how much data they produce, and that matters because the data has to be moved for every picture the camera takes. The next picture counts the numbers in each answer, on a log scale, so each step to the right multiplies by ten.
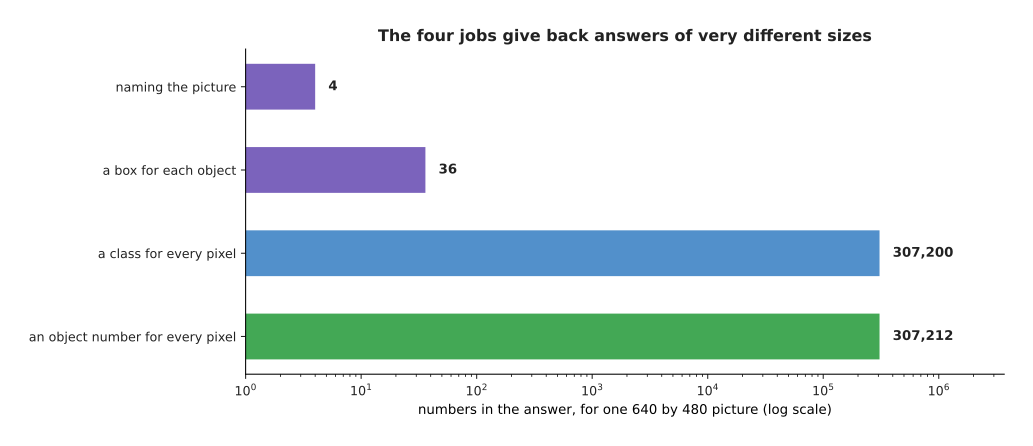
For one 640 by 480 picture, naming the picture gives 4 numbers and the six boxes give 36 numbers. Labelling every pixel with a class gives 307,200 numbers, and labelling every pixel with an object number gives 307,212.
So the two pixel-labelling jobs give back about eight thousand times as much data as the box job. If the camera runs at thirty pictures a second, all of that has to be produced and moved thirty times a second.
The last picture of this section fixes one task and asks what point each job would hand to the arm. The task is to pick up the glass nearest the camera, and that glass is shaded.
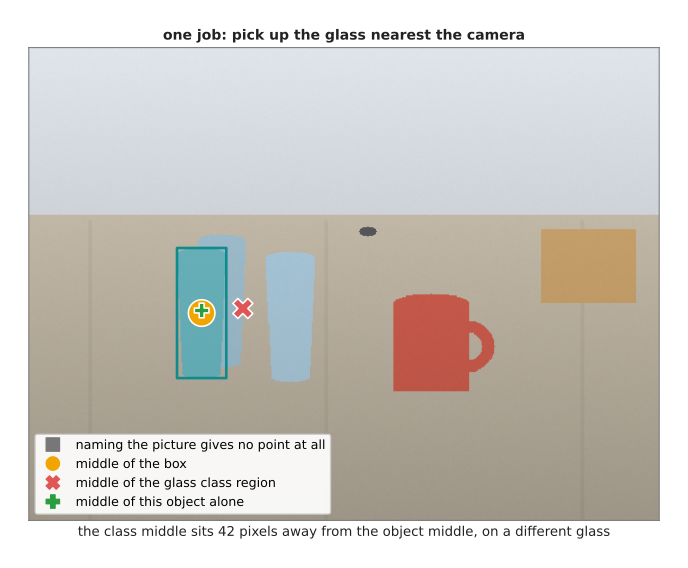
Naming the picture gives no point at all. The middle of the box and the middle of the object land 3 pixels apart, and both of them land on the glass. The middle of the glass class region lands 42 pixels away, on no glass at all.
So the plain answer to the question of which job a robot needs is this. If the arm only has to say whether anything is on the table, naming the picture is enough. If it has to count things, or point a camera at one of them, boxes are enough. If it has to move around the table without touching it, labelling by class is enough, because the table is one thing anyway. But if it has to pick one glass out of several, it needs the fourth job and not the third, because the third gives one region for all the glasses and a point 42 pixels away from the glass the arm meant to take.
2. What a box is, and how a guess is scored#
The last section settled which job to ask for. The next thing is to be precise about what a box is, and about what it means for a guessed box to be right, because the whole of training and of measurement depends on that one number.
A box is four numbers and nothing else. The next picture draws one box around the mug and then writes the same box in three different ways.
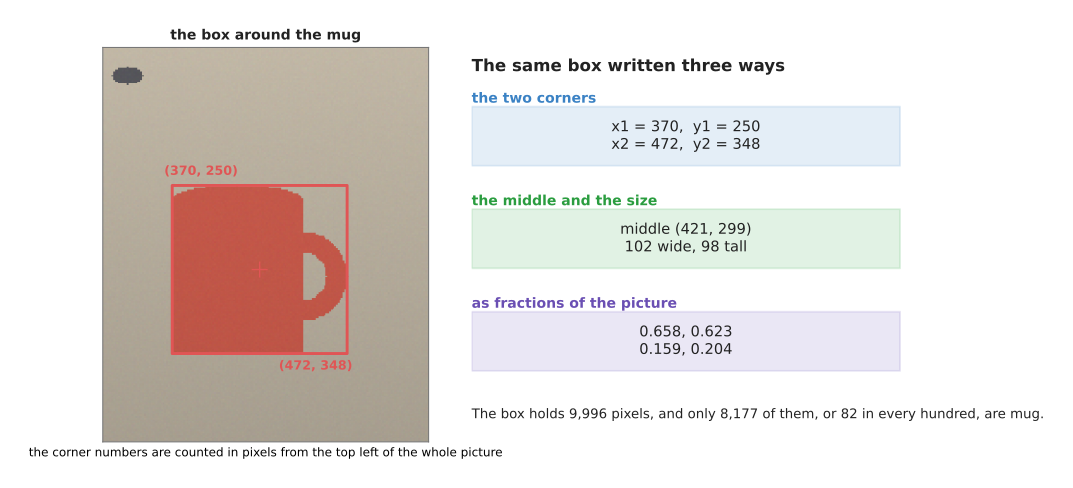
The four numbers can be the left, the top, the right and the bottom edge, which for the mug are 370, 250, 472 and 348, counted in pixels from the top left corner of the picture. The same box can be written as its middle, at (421, 299), together with a width of 102 and a height of 98. It can also be written as the fractions 0.658, 0.623, 0.159 and 0.204 of the picture.
Models usually learn the second form, the middle and the size, because the middle and the size can be predicted separately from each other. The numbers are often divided by the width and the height of the picture to give fractions, so that the same four numbers mean the same thing at any picture size. Notice already that the box holds 9,996 pixels while the mug itself holds only 8,177, so 82 in every hundred pixels inside this box are mug and the rest are table.
Now take a guessed box and a true box, and ask how close they are. The measure that everybody uses is called intersection over union, which is usually shortened to IoU. The name says exactly what it does: it divides the area the two boxes share by the area they cover together. The next picture works through that arithmetic on one guess.
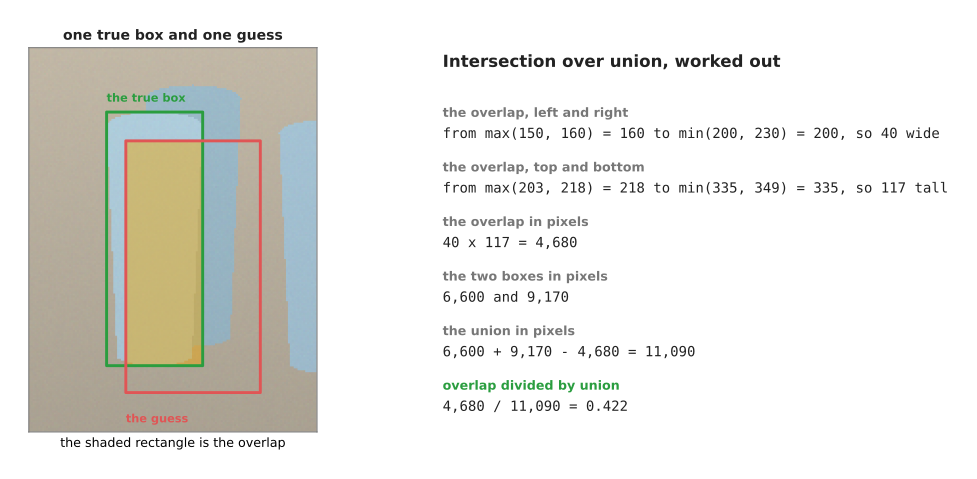
The shared area runs from the larger of the two left edges to the smaller of the two right edges, so it is 40 pixels wide. The same working from top to bottom gives 117 pixels, so the shared area is 4,680 pixels. The two boxes cover 6,600 and 9,170 pixels, so together they cover 6,600 plus 9,170 minus 4,680, which is 11,090 pixels. Dividing 4,680 by 11,090 gives 0.422.
The overlap is taken off once in that sum, because otherwise it would be counted twice. The division at the end is what makes the number useful. It is 1 only when the two boxes are identical, and it falls towards 0 as the boxes drift apart, whatever the size of the object.
People often choose a threshold on this number without knowing what the threshold allows. So the next picture shows five guesses against the same true box, each one moved further than the one before.
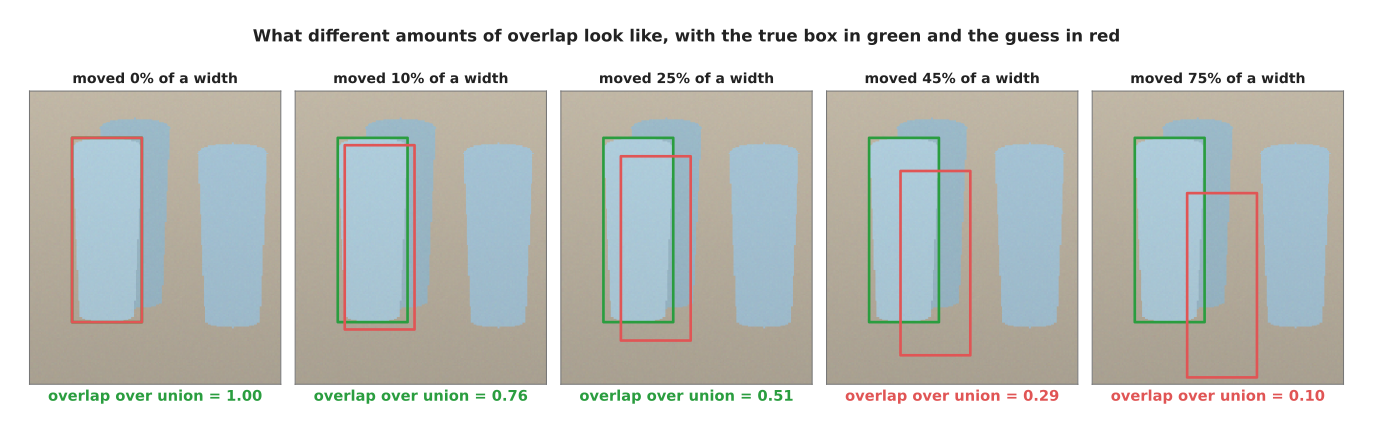
Moving the guess sideways by a tenth of the box's width drops the overlap to 0.761. Moving it by a quarter drops it to 0.509, by nearly half to 0.291, and by three quarters to 0.096.
A guess moved by a tenth of the box width scores 0.761 and still looks almost right. One moved by a quarter scores 0.509, and it is visibly off but still sits on the object. One moved by three quarters scores 0.096, and it is pointing somewhere else. That is why 0.5 is the usual line between a hit and a miss, and why a stricter line of 0.75 is used when the exact edges matter.
The threshold is not a small detail, because it changes the answer to the question "how many objects did the detector find" without anything about the detector changing at all. The next picture takes one fixed set of 21 guesses and counts the objects found at six different thresholds.
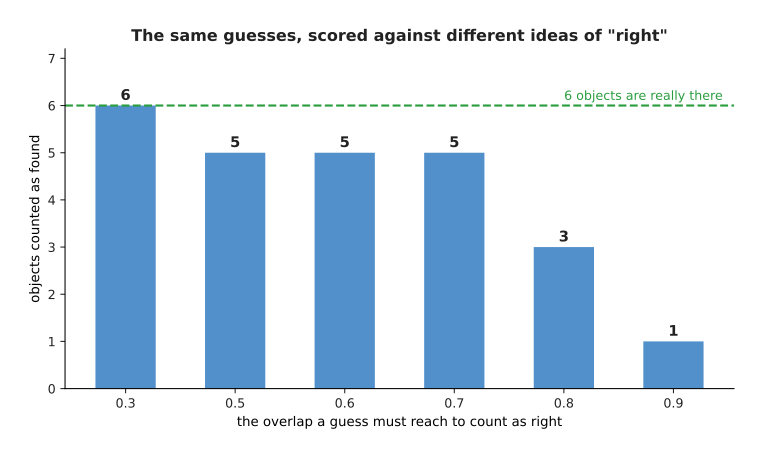
From the same 21 guesses, six objects count as found when the overlap only has to reach 0.3. Five count as found at 0.5, three at 0.8, and one at 0.9.
So a sentence such as "it found almost everything" means nothing until somebody says which threshold it was measured at. This is the commonest way in which detector results are quoted misleadingly.
3. Why a detector guesses many times#
The last section scored one guess against one object. In practice a detector hands you many more guesses than there are objects. The reason is the way it is built, and not a mistake.
A detector of the older and still very common kind asks the same question at every cell of a feature grid: is there an object here, and if there is, where are its edges? Every cell answers for itself, because no cell is told what the other cells said. The next picture shows what that produces around one mug.
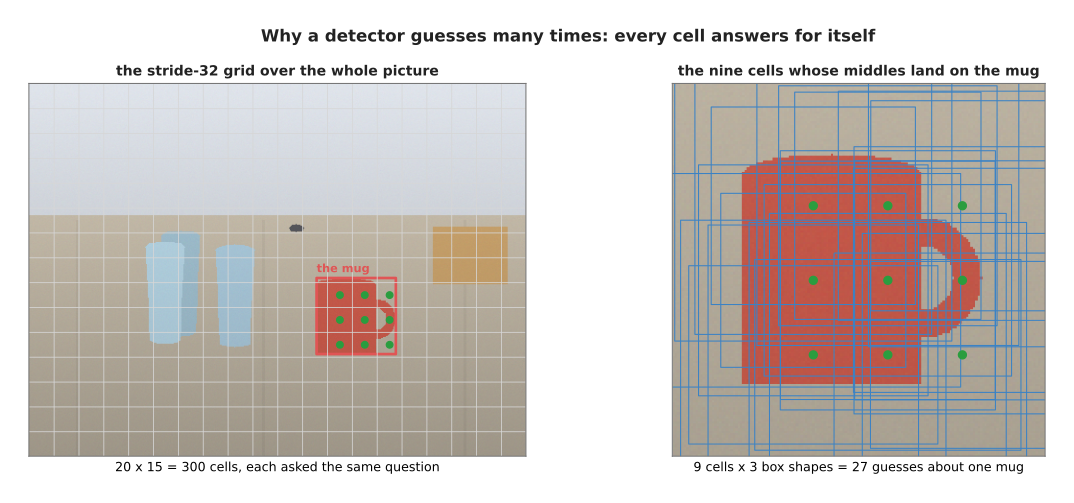
On the stride-32 grid from the last page, a 640 by 480 picture has 20 by 15 cells, which is 300 cells. Each cell is usually asked about several box shapes at once, so three shapes a cell makes 900 guesses for one picture. Nine of those cells have their middles inside the mug, and every one of those nine can see the mug perfectly well, so the detector makes 27 guesses about the mug alone.
The usual cure is a rule called non-maximum suppression. The rule keeps the box with the highest score, throws away every lower-scoring box that overlaps it by more than a set amount, then takes the best of the boxes that are left and does the same again, until there is nothing left to check. The next picture follows that rule on the real guesses from this scene. Only the 15 guesses that score 0.40 or more are drawn, so that the boxes can be told apart.
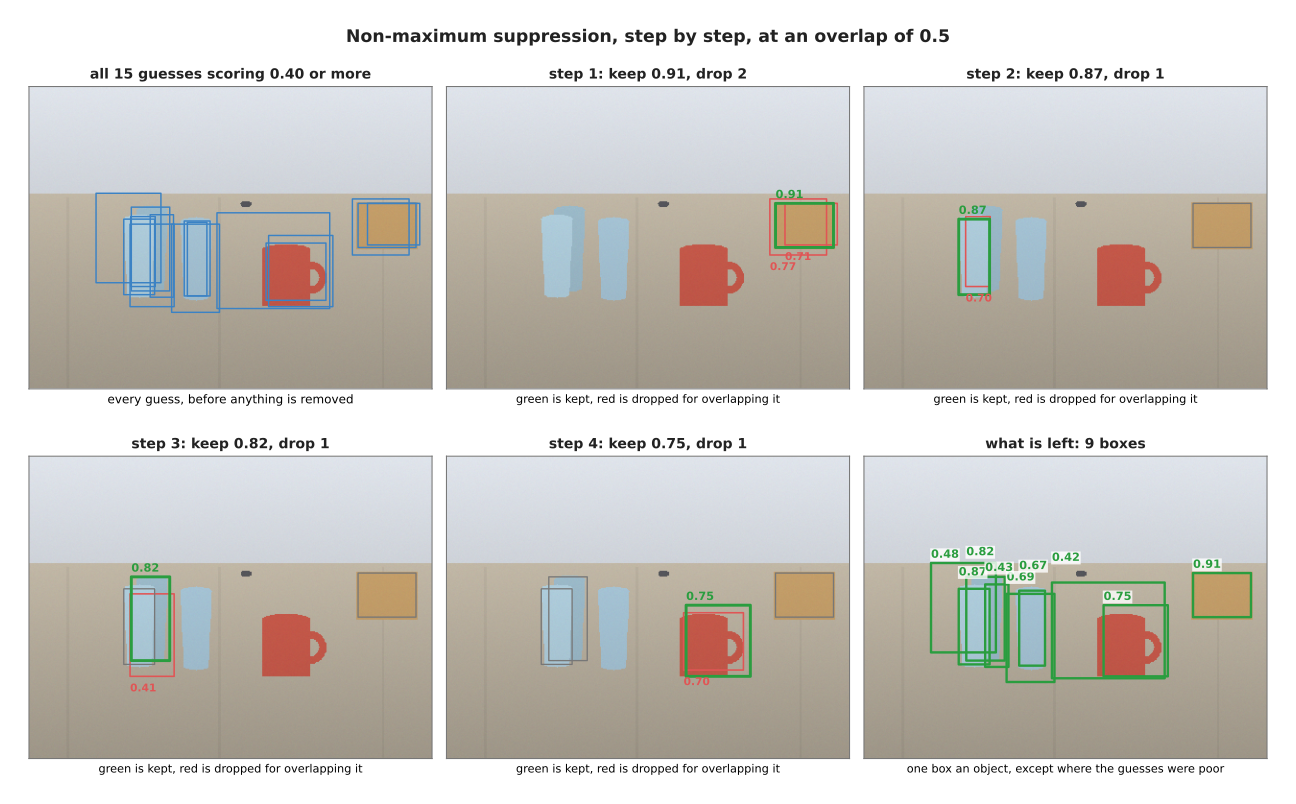
The first step keeps the guess scoring 0.91 and drops two guesses that overlap it by 0.65 and 0.74. The second step keeps 0.87 and drops one guess that overlaps it by 0.66. The third keeps 0.82 and drops one that overlaps by 0.60. The fourth keeps 0.75 and drops one that overlaps by 0.70. Nine boxes are left standing, with scores of 0.91, 0.87, 0.82, 0.75, 0.69, 0.67, 0.48, 0.43 and 0.42.
The trouble is that the amount of overlap you allow is a number somebody has to choose, and that number is wrong in both directions. The next picture sweeps it from 0.1 to 0.9 and counts how many boxes come out.
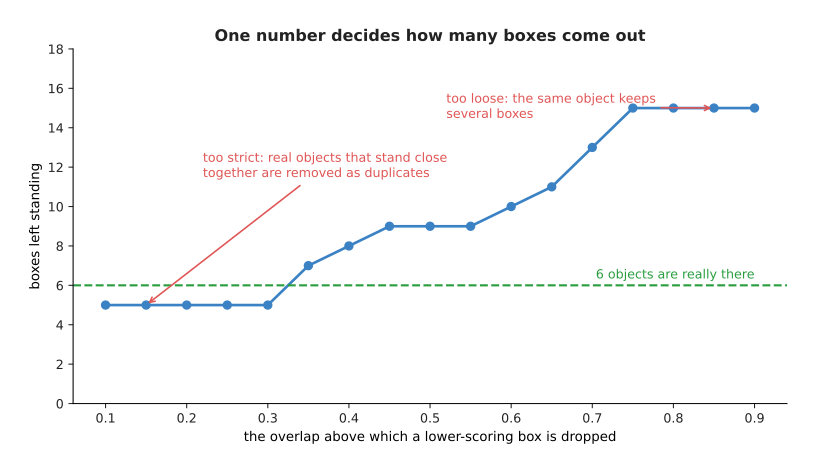
Suppressing at 0.1 leaves only 5 boxes, which is fewer than the 6 objects that are really there. Suppressing at 0.9 leaves 15 boxes, because almost nothing counted as a duplicate.
The low setting loses real objects because two objects standing close together were taken for duplicates of each other. That failure is not rare, and the two glasses in this scene show it exactly. The next picture draws their true boxes and then the result of suppressing at two settings.
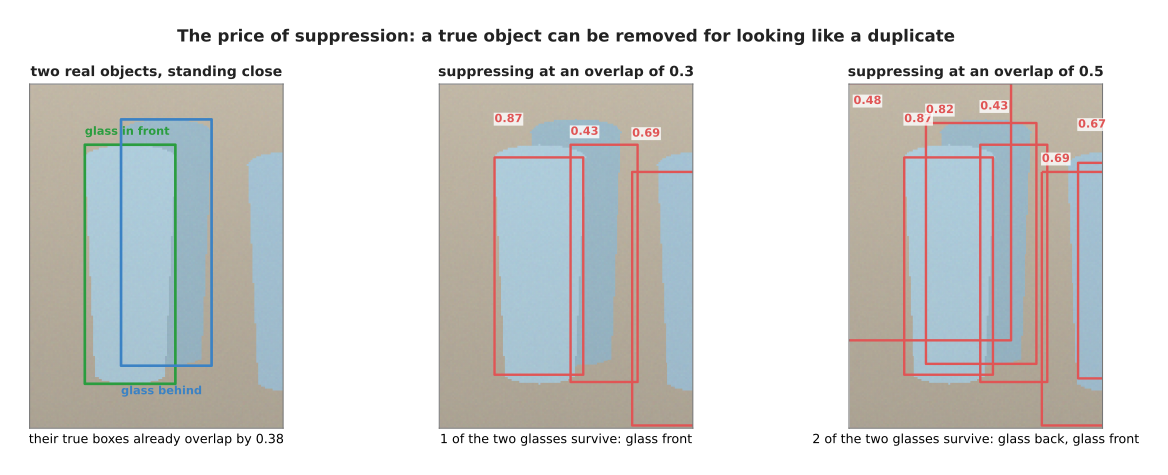
The true boxes of these two glasses already overlap by 0.376 of their union, because one glass stands partly in front of the other. So any threshold below 0.376 deletes a correct answer, and at 0.3 only the glass in front survives. At 0.5 both of them survive.
There is no setting of this one number that is right both for a crowded shelf and for a table with things spread out on it. That is the main reason why the design in section 5 exists.
4. Measuring a detector honestly#
Section 3 left us with nine or twenty-one boxes, depending on the threshold, and with no way of saying whether that was good. This section measures it properly. The measurement uses all 21 boxes that survive suppression, with no score threshold applied at all.
The measurement starts by sorting every guess by its score and then going down the list from the best score to the worst. A guess counts as right when it overlaps a real object by 0.5 or more and that object has not already been claimed by a better-scoring guess. Two numbers are kept as you go down the list. Precision is the share of the guesses so far that were right. Recall is the share of the real objects that have been found so far. The next picture shows the first twelve rows of that list as a table. Read it one row at a time from the top, and read the last two columns as the running score after that row.
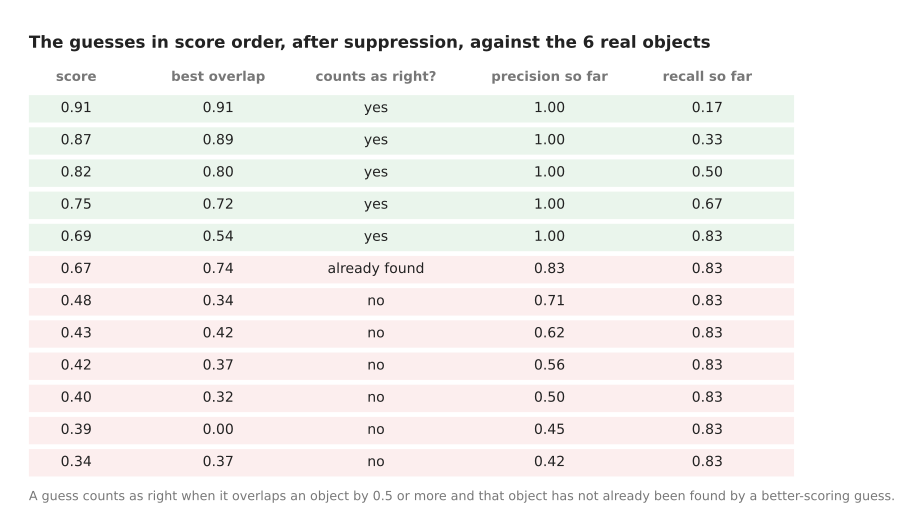
The first five guesses are all right, so precision stays at 1.00 while recall climbs to 0.83. The sixth guess scores 0.67 and overlaps an object by 0.74, and it still counts as wrong.
That sixth guess is the interesting one. It overlaps the glass on the right by 0.74, which is a good box by any standard, and it is still counted as wrong because a guess scoring 0.69 had already claimed that glass. That is how duplicates are punished.
Plotting precision against recall as you go down the list gives a curve, and the area under that curve is called the average precision. The next picture draws the curve with the area shaded.
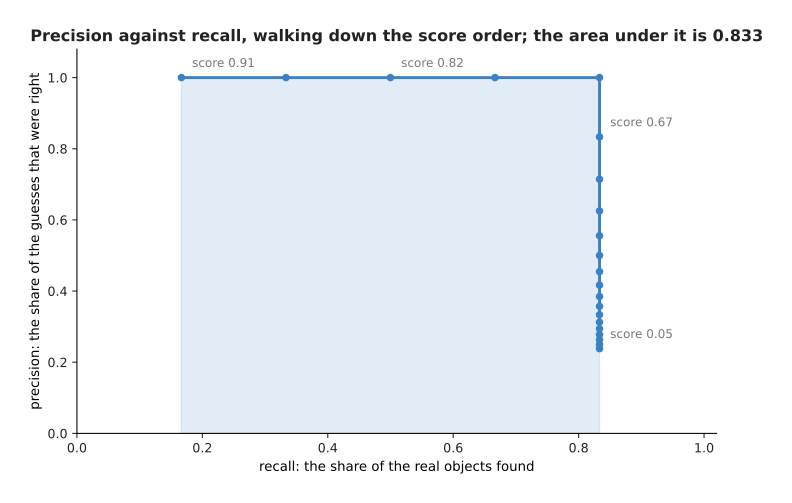
Precision stays at 1.00 until recall reaches 0.83 and then falls away to 0.24. The area under the curve is 0.833.
The curve never reaches a recall of 1.0, and the reason is worth knowing. The bolt is 18 pixels by 10, and the best guess anywhere near it overlaps it by only 0.32, so no guess covers it well enough to count. The small-object problem from the last page appears here as a number.
Average precision describes the whole curve, but a robot has to pick one point on that curve, because it either acts on a box or it does not. The next picture follows precision and recall as the score threshold rises.
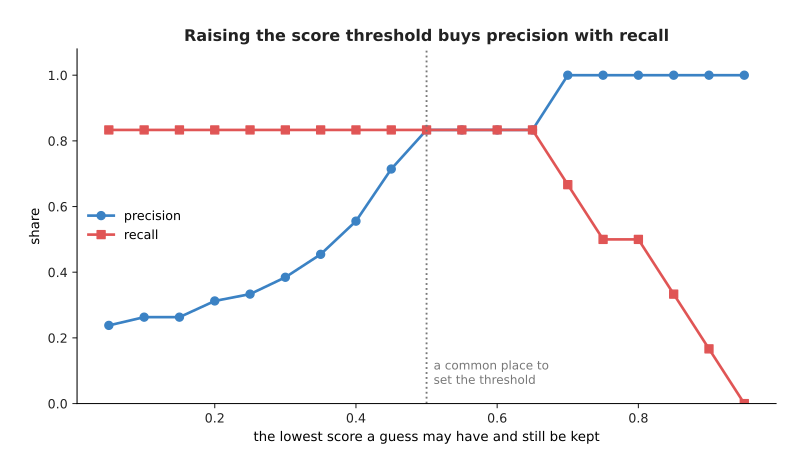
Keeping only the guesses that score 0.30 or more gives a precision of 0.38 with a recall of 0.83. Keeping those at 0.50 or more gives 0.83 and 0.83. Keeping those at 0.70 or more gives a precision of 1.00 with a recall of 0.67.
Keeping every guess that scores 0.30 or more means that most of what the arm is told about is not there. Keeping only those at 0.70 or more means that everything the arm is told about is real, and that a third of the objects are missed. Which of those is right depends on whether a wrong grasp or a missed object costs you more, and that is a question about the robot rather than about the model.
This is also where quoting results dishonestly becomes easy. A bare precision number depends entirely on which guesses were thrown away before the counting started. Average precision does not, because the curve already uses the best precision available at each level of recall. The next picture measures both on the same guesses, four times, throwing away more of the weak guesses each time.
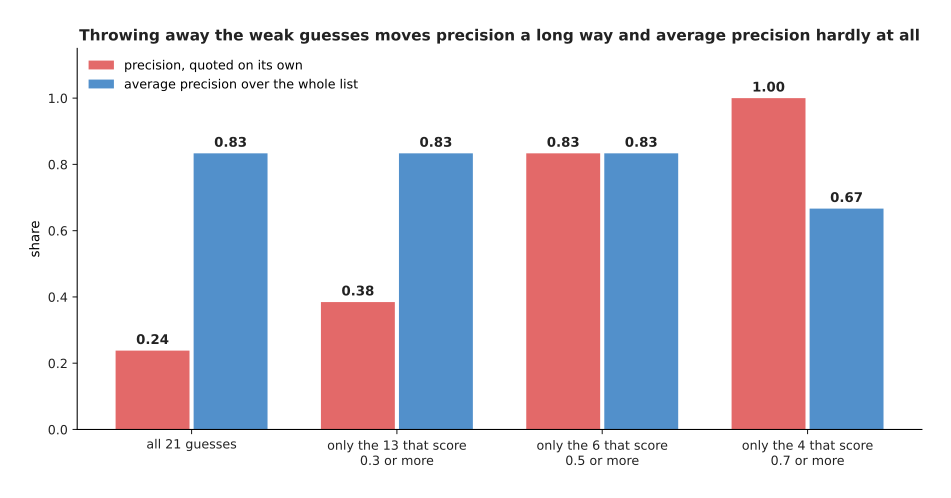
Measured on all 21 guesses, precision is 0.24 and average precision is 0.833. Measured on the 6 guesses that score 0.5 or more, precision is 0.83 and average precision is still 0.833. Only at a threshold of 0.7, where real objects start to be thrown away with the weak guesses, does average precision fall, to 0.667.
So a precision of 0.83 and a precision of 0.24 can describe the very same detector, depending only on what somebody dropped first. That is why average precision is the number people publish.
Average precision still depends on the overlap threshold from section 2, and that threshold is a choice as well. The next picture measures the same detector five times, demanding a different overlap each time.
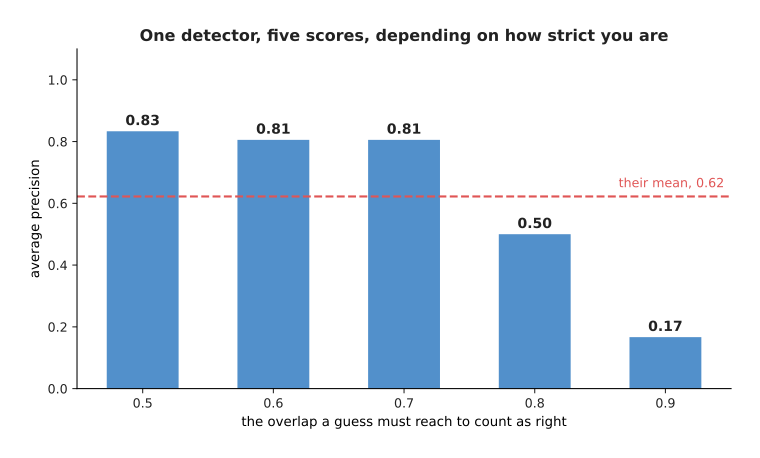
The same detector scores an average precision of 0.833 when a guess must overlap by 0.5, 0.806 at 0.6 and at 0.7, 0.500 at 0.8 and 0.167 at 0.9. The mean of those five numbers is 0.622.
Published results usually quote that mean, or a mean like it, which is where the figures given for real detectors come from. The numbers 0.833, 0.167 and 0.622 all describe the same detector on the same pictures. So when somebody quotes one of them, the useful question is which one.
5. Set prediction: slots matched one to one#
Everything in sections 3 and 4 was made harder by one thing. The detector answered many times for each object, so a clean-up step with a threshold chosen by hand had to run afterwards. The newer design removes the cause instead of the symptom.
A set-prediction detector has a fixed number of query slots, which is 20 here. Each slot gives back exactly one box, one class name, and one score for whether there is anything there at all. A slot is allowed to answer "nothing", and most of them do. The next picture shows the slots that answered, and then all 20 slots with what each one said.
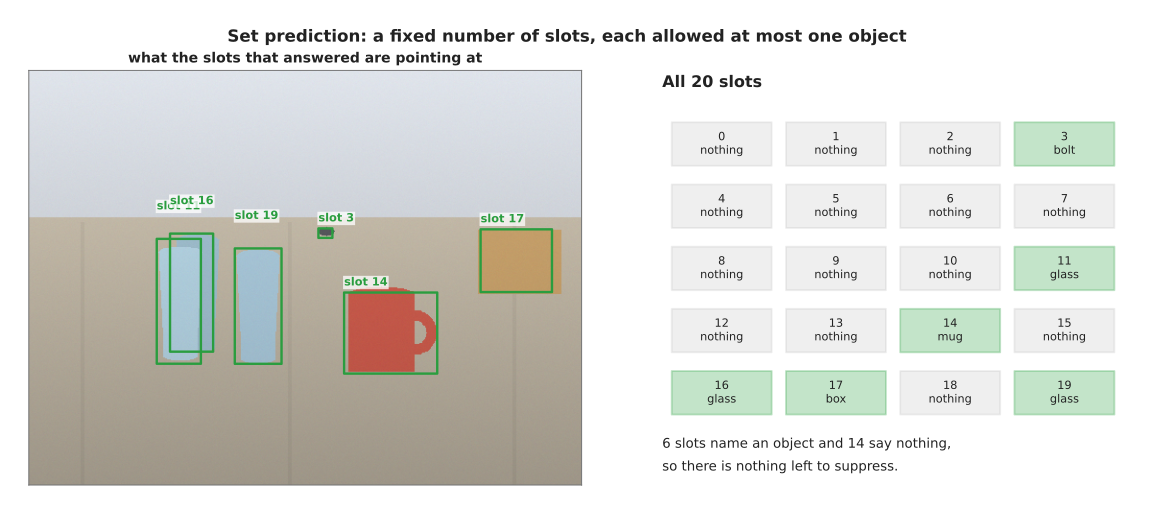
Six of the 20 slots name an object and 14 of them say nothing, against the 6 objects that are really there. The six that name an object are already the final answer, so there is nothing to suppress and no overlap threshold to choose.
What makes the slots behave like that is how they are trained. For each training picture, the cost of pairing every slot with every real object is worked out. The cost used here is one minus the overlap, plus twice the distance between the two middles divided by the diagonal of the picture. Then the one-to-one set of pairings with the lowest total cost is chosen. The next picture shows six candidate slots over three glasses, and the table of every pairing's cost.
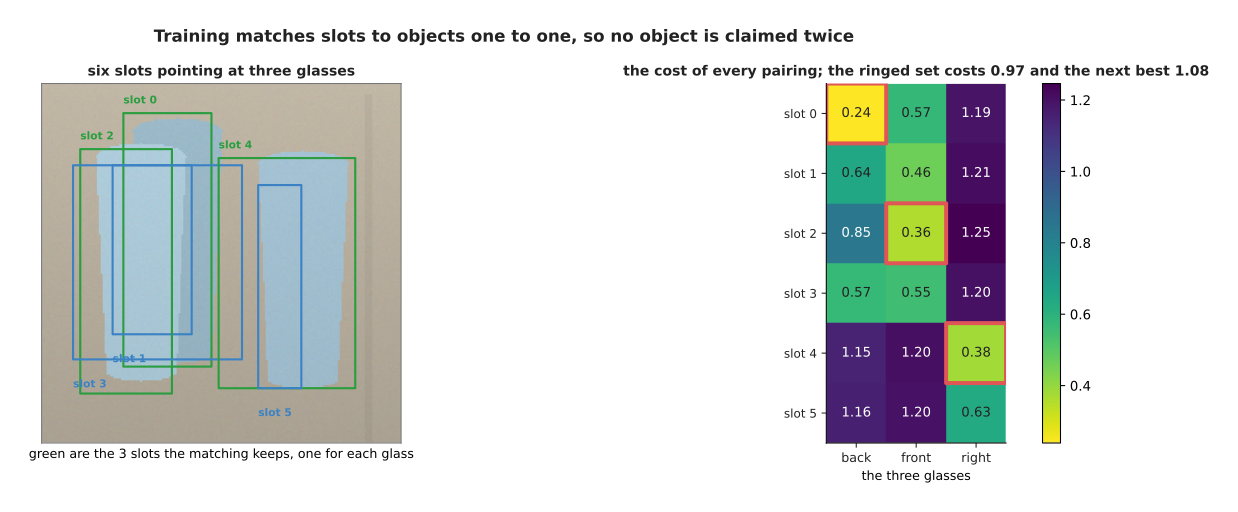
The diagonal of this 640 by 480 picture is 800 pixels. The cheapest set of three one-to-one pairings costs 0.975 in total, and the next cheapest set costs 1.081, which is 11 per cent more.
Because the pairing is one to one, each real object is given to exactly one slot, and each slot is given at most one object. Every slot that was not paired is then trained to answer "nothing". That one-to-one rule is what makes the whole design work, and it is worth seeing on a single object.
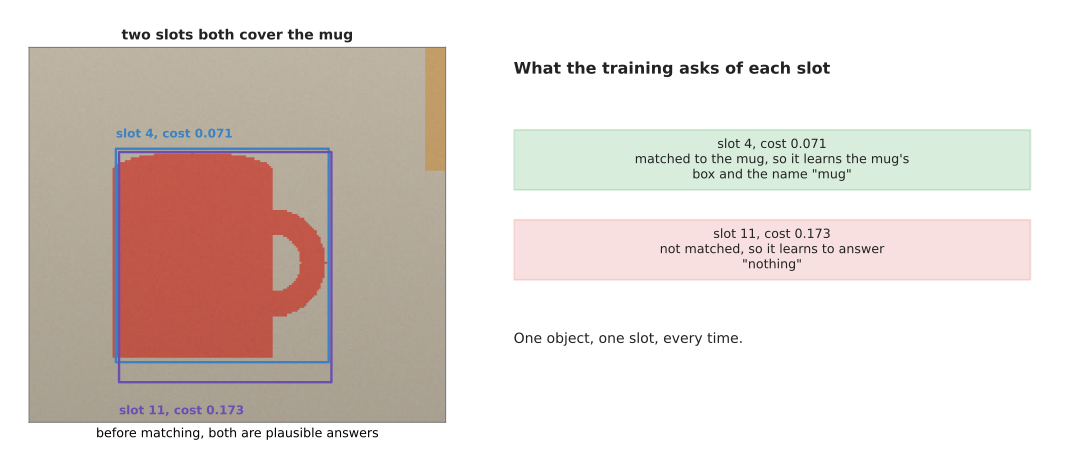
Two slots both cover the mug well, at a cost of 0.071 and 0.173. The matching gives the mug to the cheaper of the two and trains the other one to answer "nothing".
Nothing about either box is wrong. Both of them would be perfectly good answers. Only the cheaper one is allowed to keep the mug, and the other is told that the right answer there is "nothing". Over many pictures this teaches the model that answering twice is always punished, so by the end of training it does not answer twice.
The next picture compares what each design finally gives back, against the six objects that are really in the picture.
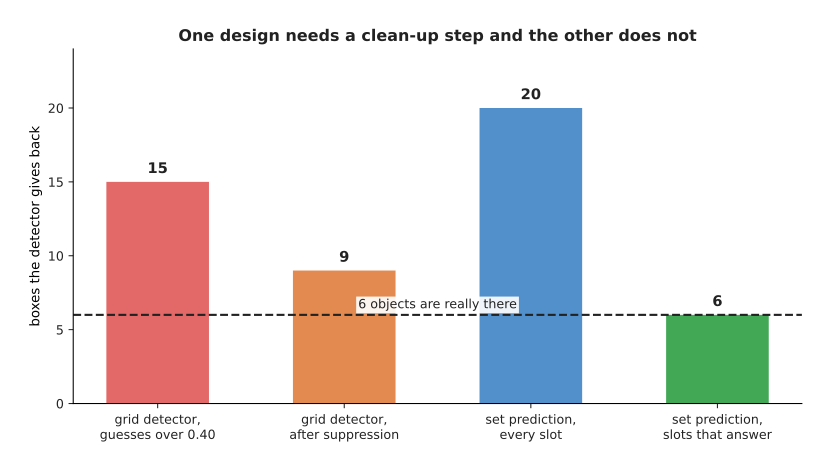
The grid detector gives back 15 guesses above 0.40, and 9 after suppression. The set-prediction model gives back 20 slots, of which 6 answer. Six objects are really there.
What you gain is that the output is already the answer. There is no threshold to tune when the robot moves to a new table, and nothing deletes a real object for standing too close to another one. What you give up is that the number of slots is a fixed limit, so a model with 20 slots can never report 21 objects. These models also take considerably longer to train, because early in training the matching keeps changing its mind about which slot owns which object. Named models of both kinds are listed in object detection.
6. Masks, and models that take a prompt#
The last four sections were all about boxes, and section 2 showed that a box holds many pixels that are not the object. This last section is about the answer that does not: a mask, which is one number for every pixel saying whether that pixel belongs to the thing.
A mask is not a shape or an outline inside the computer. It is a grid of numbers, the same size as the region it describes, each number between 0 and 1, saying how sure the model is that this pixel is part of the object. The next picture shows the mug's mask, then one small window of the numbers behind it, then the same window after the numbers are cut at 0.5.
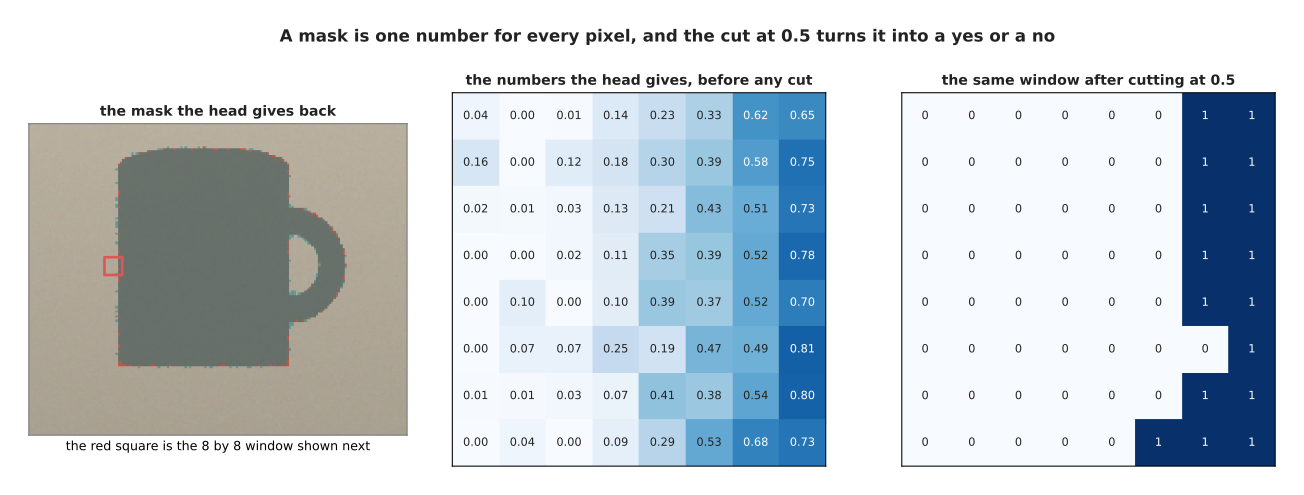
Each row of the window climbs from near 0 on the table side to about 0.7 on the mug side, across eight pixels. Cutting at 0.5 turns those numbers into zeros and ones. For this mug the cut mask holds 8,174 pixels against the true 8,177, and the two agree on 8,086 of the 8,265 pixels that either of them claims, which is an overlap of 0.978.
The usual way to get a mask is to put a small head on top of the detector. The features inside each box are cut out and squashed to a fixed grid of 14 by 14, so that the head always sees the same shape whatever size the object was. The next picture draws the layers of that head, with the shape of the numbers at each step.
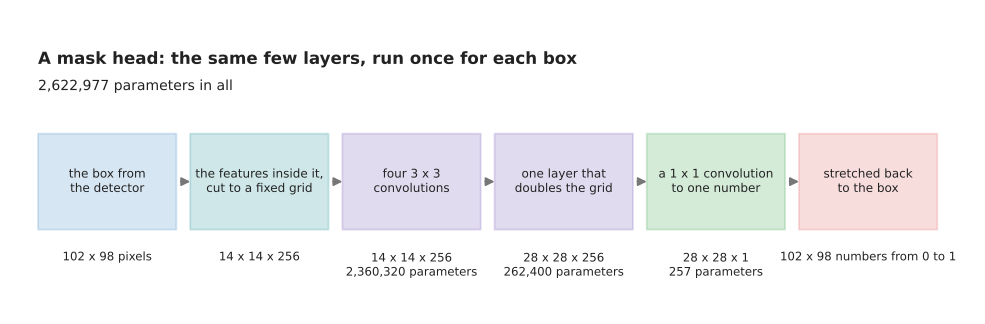
Four 3 by 3 convolutions of 256 channels run over the 14 by 14 grid, which costs 2,360,320 parameters. One layer doubles the grid to 28 by 28, which costs 262,400. A 1 by 1 convolution then brings each place down to a single number, which costs 257. That is 2,622,977 parameters in all, and those 28 by 28, or 784, numbers are stretched to the size of the box, which for the mug is 9,996 pixels.
The head only ever answers inside the box, so it never has to say anything about the rest of the picture. That is what keeps it small.
The head runs once for every box the detector found, and that is why masks cost more than boxes on a robot. The next picture draws the consequence. The backbone's arithmetic is a flat line, because the backbone runs once for the picture, and the mask head's arithmetic is a rising line.
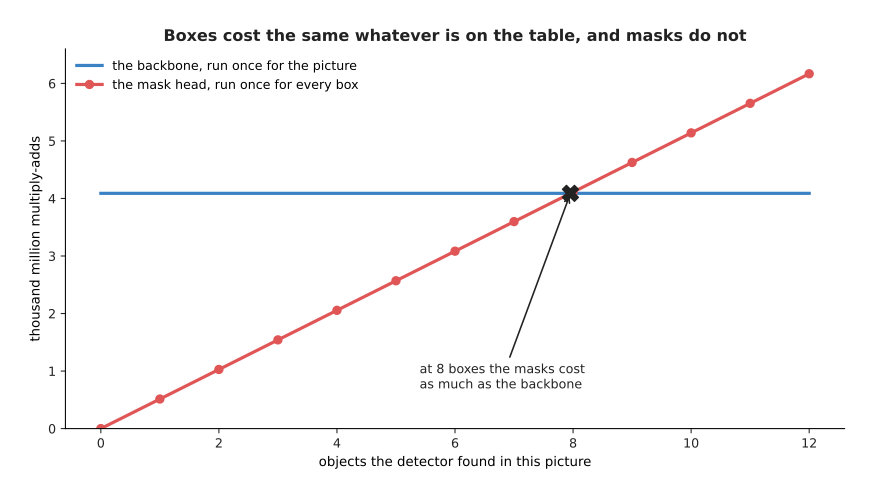
One run of the mask head costs 514 million multiply-adds. One run of a 50-layer convolutional backbone on a 224 by 224 picture costs 4.09 thousand million. So once there are about 8 objects to mask, the masks cost as much as the backbone that found them.
The other cost of a mask head is accuracy, and it is lost in the stretching. The head draws on a small grid, and that small drawing then has to be stretched to the size of the box. The next picture draws the mug's mask at three grid sizes and measures the loss at five.
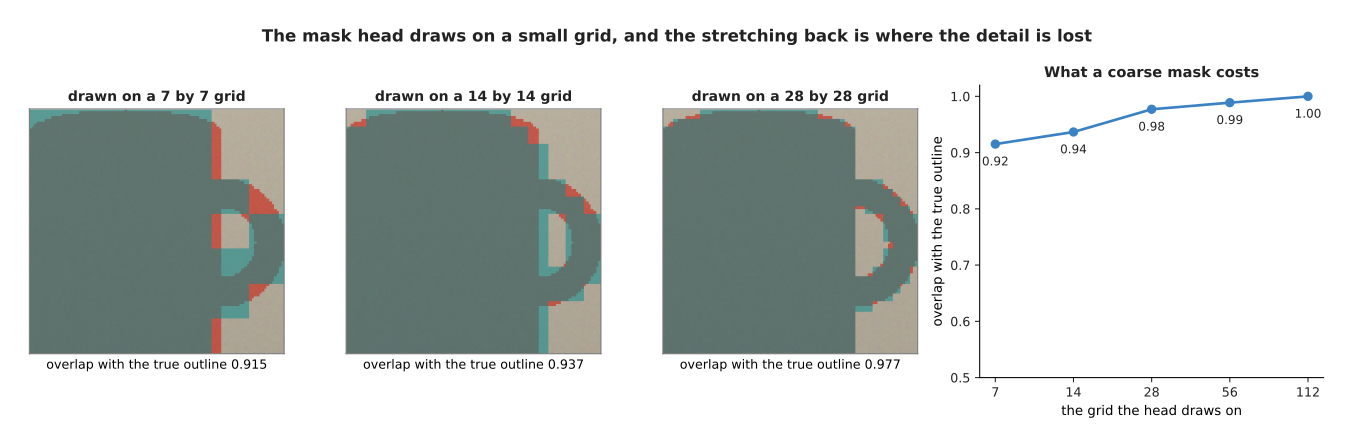
A mask drawn on a 7 by 7 grid and stretched back overlaps the true outline by 0.915. A 14 by 14 grid gives 0.937, a 28 by 28 grid gives 0.977 and a 56 by 56 grid gives 0.989.
Those look like small losses until you ask where the wrong pixels are. At 14 by 14, 419 of the 540 wrong pixels lie in the thin handle of the mug. So a coarse mask is good enough for the body of a thing and poor at anything thin. That matters a great deal when the thin part is the part the arm has to grip.
The newest kind of segmentation model changes the question. Instead of being trained on a list of classes and asked which pixels are mugs, a promptable segmentation model is given a point or a box and asked which pixels belong to the thing there. The Segment Anything family of models works this way. The next picture shows one point prompt answered twice and one box prompt answered once.
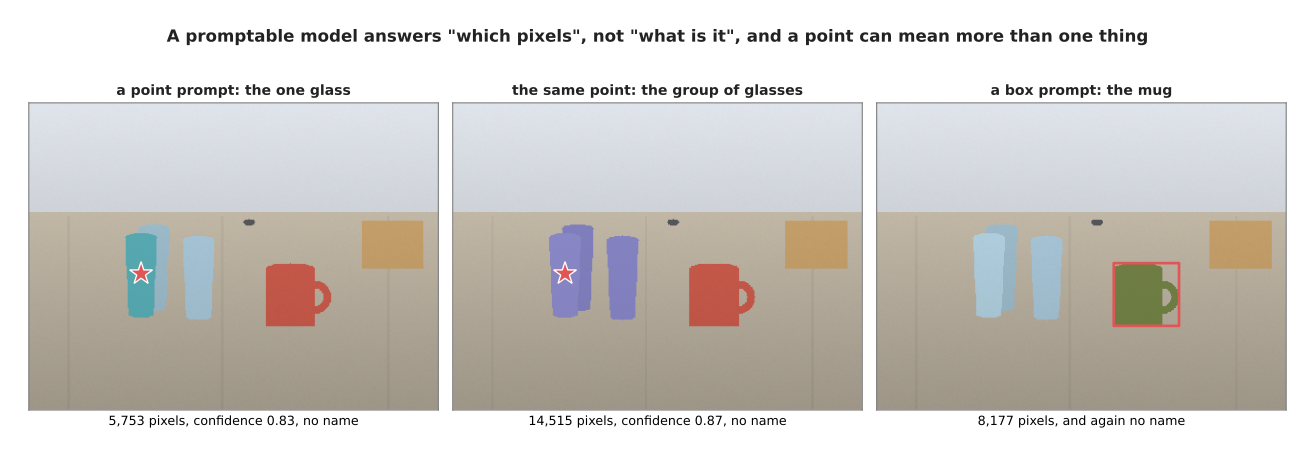
A point at (175, 266) can honestly mean the one glass, which is 5,753 pixels, or the group of glasses, which is 14,515 pixels. So the model returns more than one mask, with a confidence for each one, and lets whatever asked the question choose. None of these answers carries a class name, because the model was never told what any of these things are called.
That is exactly why these models are used inside robot programs as a tool rather than as a recogniser. Something else decides what to pick, usually a detector or a vision-language model. The promptable model is then handed that box or that point and asked only for the pixels, which it does well even on objects nobody trained it on. Those pixels are what the grasp is worked out from, as the next picture shows.
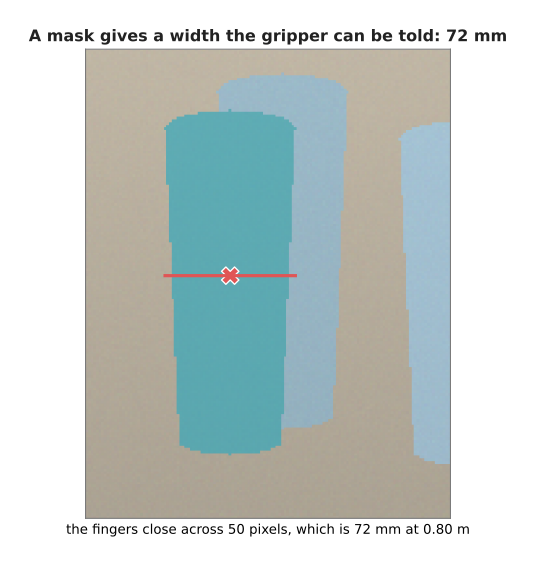
The mask of the near glass is 50 pixels across its narrow way. The camera is 640 pixels wide with a 60 degree view, so its focal length is 554 pixels, and at 0.80 metres one pixel is 1.44 millimetres. The narrow way is therefore 72 millimetres, which is a number the gripper can be given.
A point chosen inside the box alone carries no such promise, because a box says nothing about which of its pixels belong to the object. The next picture shades the parts of the mug's box that are not mug.
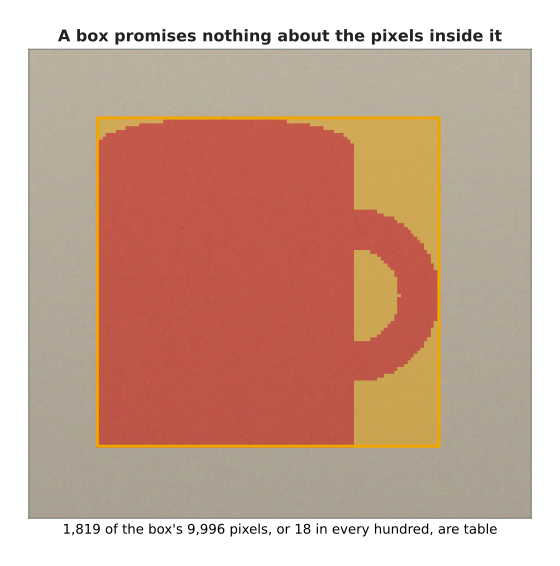
The mug's box holds 9,996 pixels and the mug holds 8,177, so 1,819 of the box's pixels, or 18 in every hundred, are table.
So the choice between a box and a mask depends on what the robot does next. If the next step only needs to know roughly where the object is, the box is enough and it is far cheaper. If the next step needs the pixels themselves, such as how wide to open the fingers, only the mask will do.
7. Where to read next#
- Open-vocabulary vision is the next page, and it removes the fixed list of class names from everything on this page, so that a detector can be asked for a thing nobody listed when it was trained.
- Depth and 3D then turns a mask on a screen into a place in the room, which is what the arm actually needs before it can move.
- Vision-language models explains the kind of model that decides what to point a promptable segmenter at, by reading an instruction and a picture together.
- Behaviour cloning and action chunks shows what happens after the seeing, when a model turns what it saw into movement.
- Object detection is the catalogue page for real detectors, with what each one costs and where each one fails.
- Segmentation does the same for mask models, including the promptable ones and how they are used on an arm.
8. Using it in Python#
The arithmetic in sections 2 and 3 is one line each in torchvision, and the
numbers below are the ones this page worked out by hand.
import torch
from torchvision.ops import box_iou, nms
from torchvision.models.detection import maskrcnn_resnet50_fpn

truth = torch.tensor([[150., 203., 200., 335.]])   # section 2: the true box
guess = torch.tensor([[160., 218., 230., 349.]])   # section 2: the guess
print(box_iou(truth, guess))                       # tensor([[0.4220]])

boxes = torch.tensor([[522., 185., 614., 255.],    # section 3: three guesses
                      [513., 178., 603., 267.],    # about the same box on the table
                      [537., 185., 620., 251.]])
scores = torch.tensor([0.91, 0.77, 0.71])
print(nms(boxes, scores, iou_threshold=0.5))       # tensor([0]): only the best survives

model = maskrcnn_resnet50_fpn(weights=None).eval()  # boxes and masks together
with torch.no_grad():
    out = model([torch.zeros(3, 480, 640)])[0]      # one 640 by 480 picture
print(sorted(out.keys()))                           # ['boxes', 'labels', 'masks', 'scores']
print(out['boxes'].shape, out['masks'].shape)       # (N, 4) and (N, 1, 480, 640)
The library gives you the overlap arithmetic, the suppression rule, and a whole
trained detector with a mask head on it, and the shapes it hands back are the
ones this page described. Note that masks comes back at the full picture size
even though the head drew on a 28 by 28 grid. The stretching has already
happened, and with it the loss measured in section 6.
What the library will not do is decide the two numbers that matter. The
suppression threshold in nms is the one from section 3, and setting it too
low deletes real objects that stand close together, as the two glasses showed.
The score threshold that you apply to out['scores'] is the operating point
from section 4, and it moves precision and recall against each other, with
nothing to tell you which way to go except what a mistake costs your robot.
What the library also will not tell you is whether you needed a mask at all. Boxes are smaller, faster, and enough for counting and for pointing a camera. A mask costs a head that runs once for every box, and that cost is only worth paying when something afterwards uses the pixels, such as how wide to open the fingers, or which of three glasses standing together the arm is about to grip.